eye-share Workflow Report module
Strengthen your business with data-driven insight and analytics
Elevate your decision-making with the Reporting module in eye-share Workflow. Access real-time numbers, trends, patterns, and deviations through a simple, user-friendly interface. Leverage advanced analytics to future-proof your operations.
Report module
Discover the hidden value in your data
In today’s fast-paced business environment, understanding, interpreting, and analyzing data is crucial.
eye-share Workflow Report provides an advanced analysis tool that integrates data from multiple sources, automates data updates, and offers powerful visualizations and business intelligence (BI) functionality. Make informed decisions with ease.
Key functionality in eye-share Workflow | Report

Data sources
We use Power BI from Microsoft to connect you to the data sources in eye-share to visualize what is important to you.

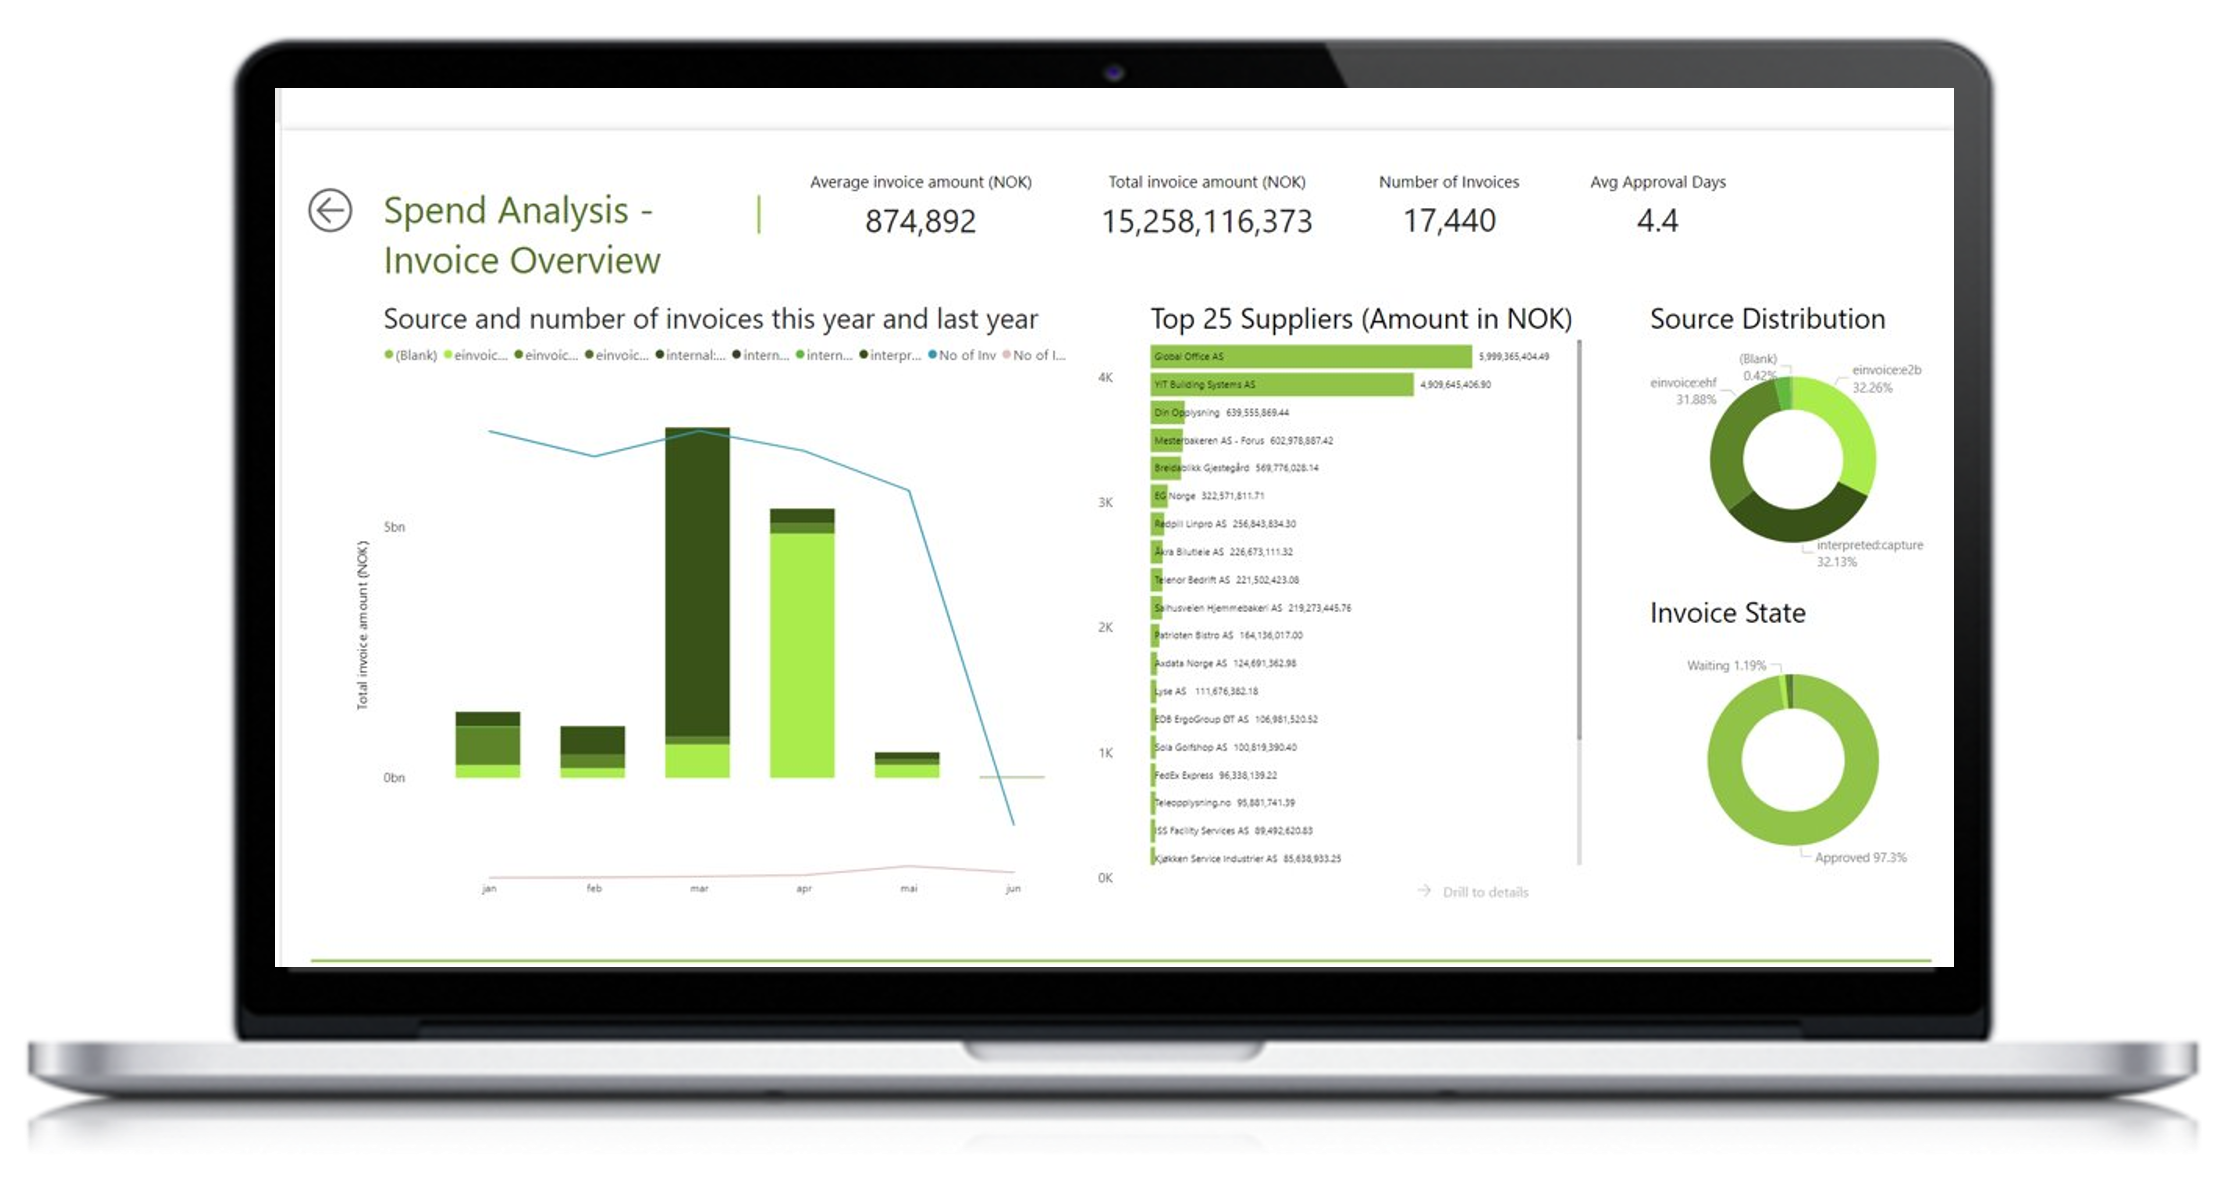
Visualization
Data visualization makes your job easier, more engaging, and understandable. Get a user-friendly presentation of your data.

Reports
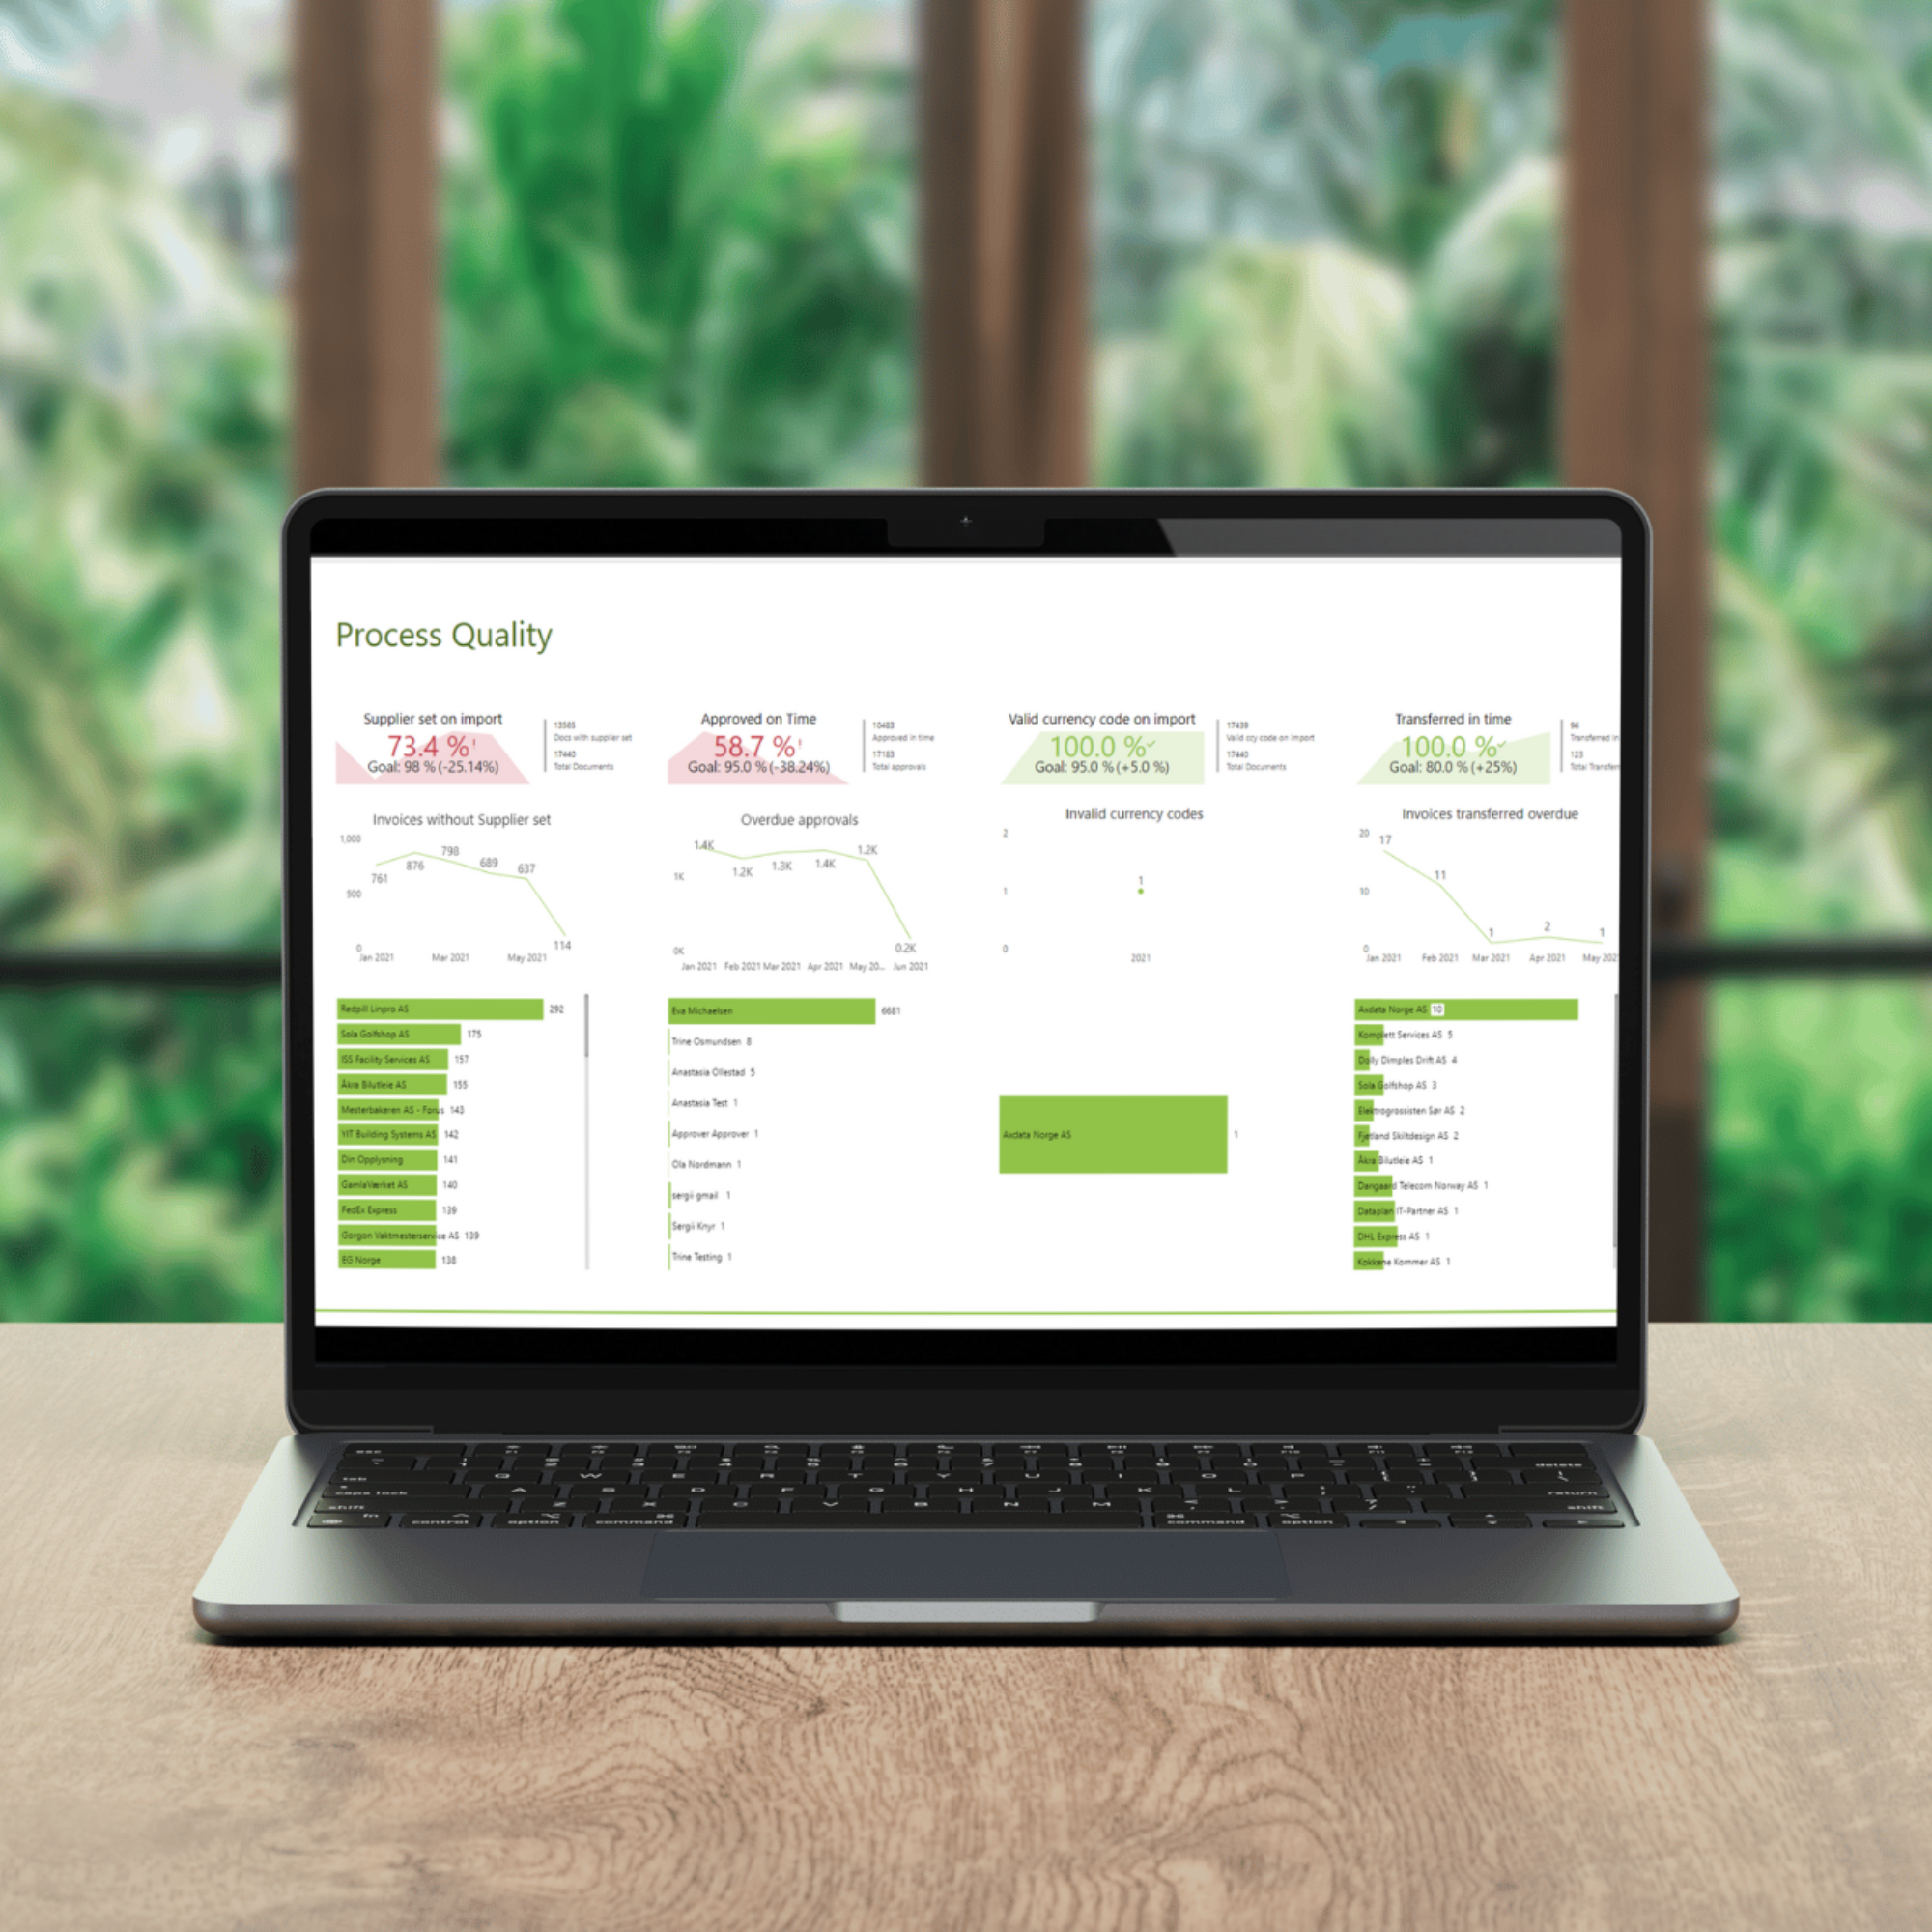
A dashboard gives you access to advanced analysis options. It is easy to retrieve reports. Save time and resources.

Strategic insight
Get updated key figures in real time. Discover patterns, trends and deviations. Make better decisions based on strategic insight!

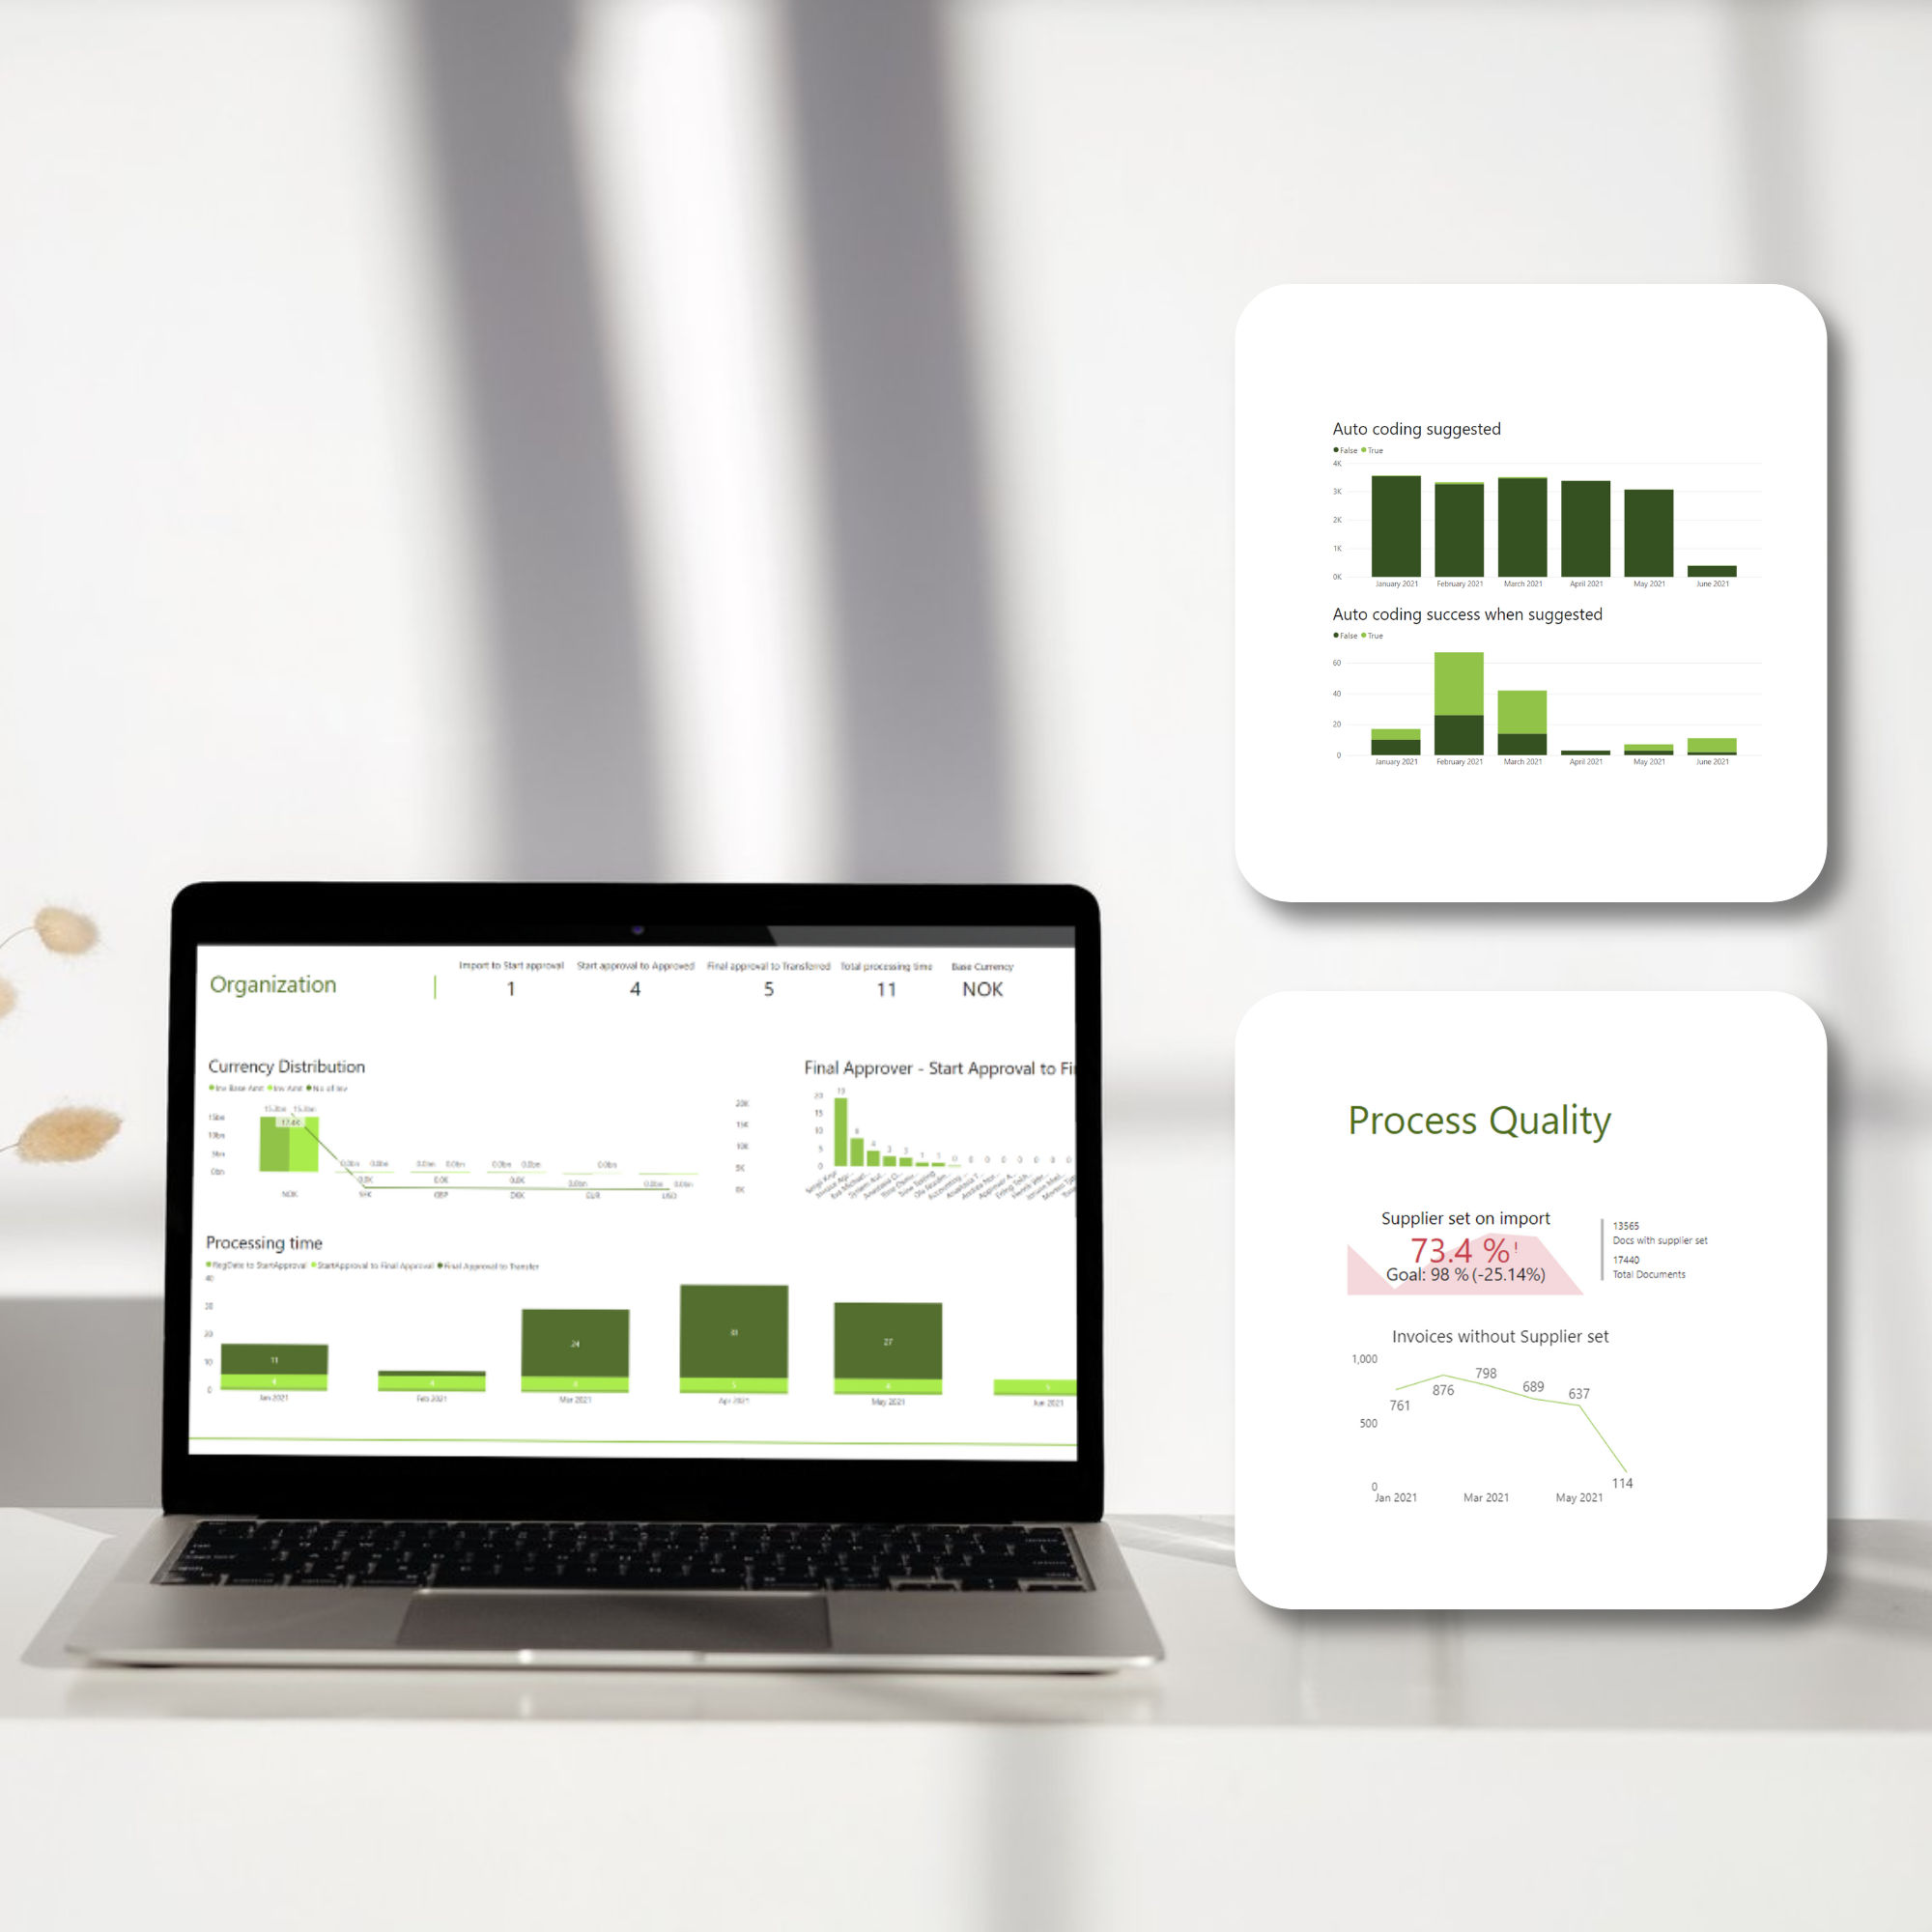
Intelligent decisions
With data, analysis and AI that automates, supports, and enhances the decision-making process, you get a new source of increased business value!
Key benefits
Unlock the powerful insights
Transition from gut feelings to data-driven strategies and uncover the hidden potential within your data. eye-share Workflow Reporting, powered by Microsoft’s Power BI, provides comprehensive, interactive reports and visual analysis. Automatically link to your accounting system or other sources and update with a click.
- Enhanced decision-making: Make informed decisions with real-time data and advanced analytics.
- Automated data updates: Save time with seamless data integration and automated updates.
- Comprehensive visualizations: Simplify complex data with clear, interactive visual representations.
- Business Intelligence tools: Dive deeper with BI functionalities for strategic planning.
Other relevant eye-share Workflow modules
It is easy to connect eye-share Workflow with other modules, to cover the entire process from Purchase-to-Pay.


